Tote Dynamics: Deriving Probabilities from Fluctuating Parimutuel Pools in Thoroughbred Racing
Thoroughbred racing meets rely on parimutuel wagering systems where bettors compete against each other rather than a bookmaker and the final payouts depend on the total pool size after deductions. Observers note that live tote boards update continuously as wagers flow in and these fluctuations provide raw data for calculating implied probabilities at any given moment. Research from industry reports shows that bettors and analysts track these changes to estimate the market's collective assessment of each horse's chances before post time arrives.
Parimutuel Pool Mechanics and Probability Basics
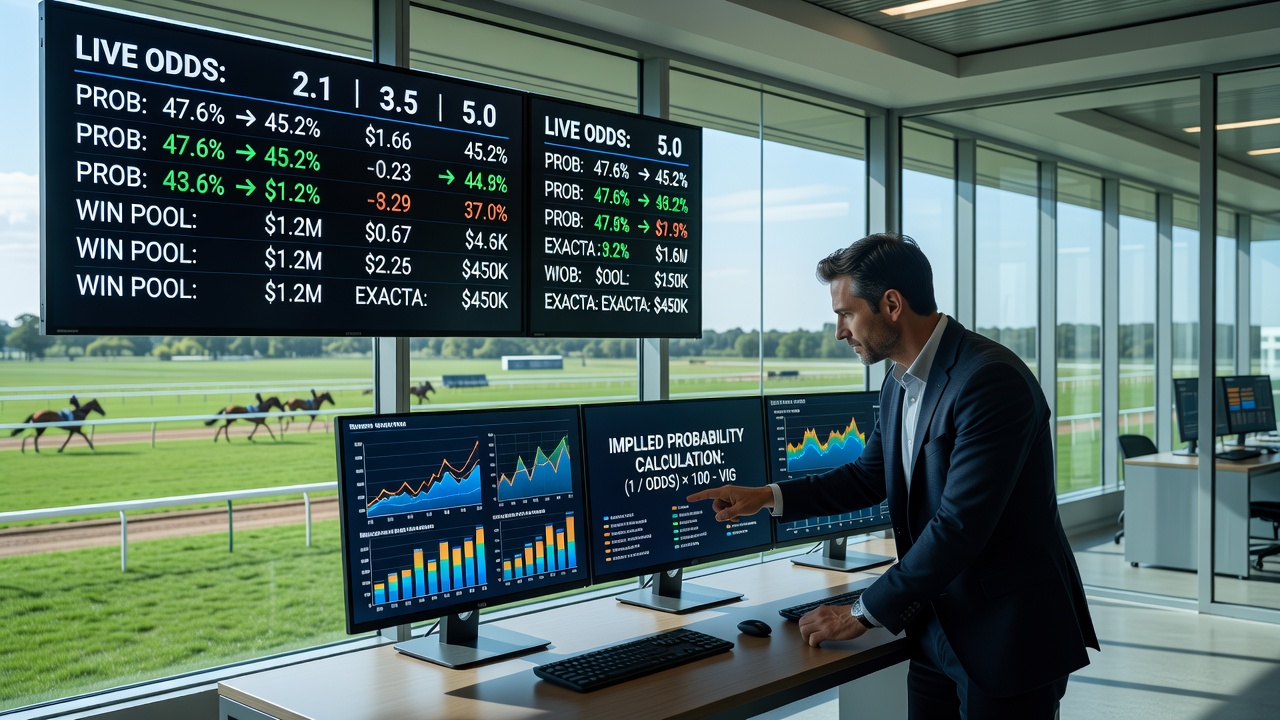
Parimutuel pools operate by collecting all wagers on a specific bet type then subtracting the track takeout before distributing the remainder among winning tickets. Data indicates that the implied probability for a horse emerges directly from the current odds displayed on the tote board since those odds reflect the proportion of the pool bet on that entrant. Experts have observed that converting those odds requires dividing one by the decimal representation of the payout which yields the percentage chance the market assigns based on current betting volume.
Layered pools add complexity because separate pools exist for win, place, show and various exotic bets such as exactas and trifectas. Studies found that each layer maintains its own independent pool and takeout rate so implied probabilities must be calculated separately while cross-referencing to detect inconsistencies across bet types. Those who've studied this know that a horse showing 4-to-1 odds in the win pool carries an implied probability of approximately 20 percent before any further adjustments for the track's takeout percentage.
Tracking Live Fluctuations During Meets
Tote boards refresh in real time as new bets enter the system and sharp changes often occur when large wagers hit certain horses or when late money shifts the distribution. Figures reveal that monitoring the rate and direction of these movements helps isolate genuine probability shifts from random noise in smaller pools. According to records maintained by racing data providers such movements become more pronounced in the final minutes before a race when professional syndicates and high-volume players finalize their positions.
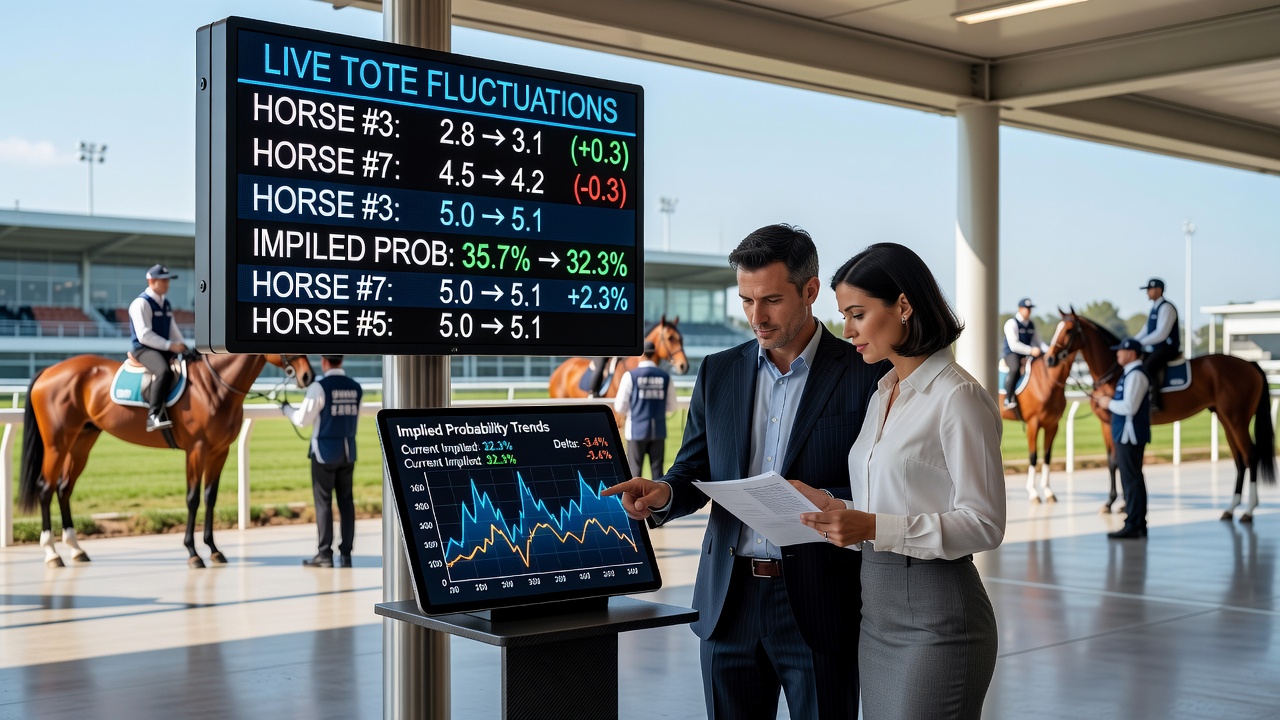
June 2026 meets at several North American tracks demonstrated heightened volatility in tote readings during twilight cards where multiple overlapping races created simultaneous pool activity. Analysts tracking these events documented how a sudden 15 percent swing in one horse's share of the win pool translated into an immediate recalibration of its implied probability while adjacent place and show pools lagged by several seconds. Such timing differences arise because each pool processes tickets through separate computational queues before updating public displays.
Adjustments for Takeout and Layer Interactions
Takeout rates vary by jurisdiction and bet type so raw odds require normalization before probability estimates reach usable accuracy. Research indicates that subtracting the takeout from the total pool and then recalculating each horse's share produces a probability figure that accounts for the house edge embedded in every wager. Observers note that ignoring this step leads to overstated probabilities that do not reflect the actual return a bettor would receive if the current odds held until post.
Layered interactions become evident when money poured into exotic pools influences straight-pool odds through hedging activity. Data from multiple meets shows that large exacta wagers can indirectly move win-pool percentages when syndicates balance their risk across correlated bets. Those monitoring these patterns often compare the implied probabilities across layers to identify potential overlays where one pool underprices a horse relative to its pricing in another pool.
Practical Calculation Examples from Recent Meets
Consider a win pool totaling $450,000 after takeout with one horse attracting $90,000 in bets. The resulting 20 percent share of the pool produces tote odds near 4-to-1 and an implied probability of 20 percent before further refinement. When the same horse shows 18 percent in the place pool and 22 percent in the show pool the divergence signals differing bettor sentiment across wager types. Analysts then average or weight these figures depending on the intended betting strategy.
Another case from a June 2026 card involved rapid late money that dropped a favorite from 3-to-1 to 5-to-2 within ninety seconds. The implied probability rose from roughly 25 percent to 28.6 percent illustrating how quickly the market can revise its collective view. Cross-checking against the trifecta pool revealed consistent support which reinforced the updated probability rather than flagging it as an outlier.
Conclusion
Calculating implied probabilities from live tote board data requires continuous monitoring of pool shares, takeout adjustments and cross-layer comparisons to capture the evolving market consensus during thoroughbred racing meets. The methods rely on straightforward arithmetic applied to real-time figures yet the presence of layered pools and rapid fluctuations demands careful timing and verification. Industry sources such as the North American Pari-Mutuel Regulators Association and academic studies published through university racing programs continue to supply the foundational data that supports these calculations across different jurisdictions.