Steady Stakes: Adapting Bankroll Units to Sports Betting Volatility
Steady Stakes: Adapting Bankroll Units to Sports Betting Volatility

Bankroll Foundations in Sports Betting
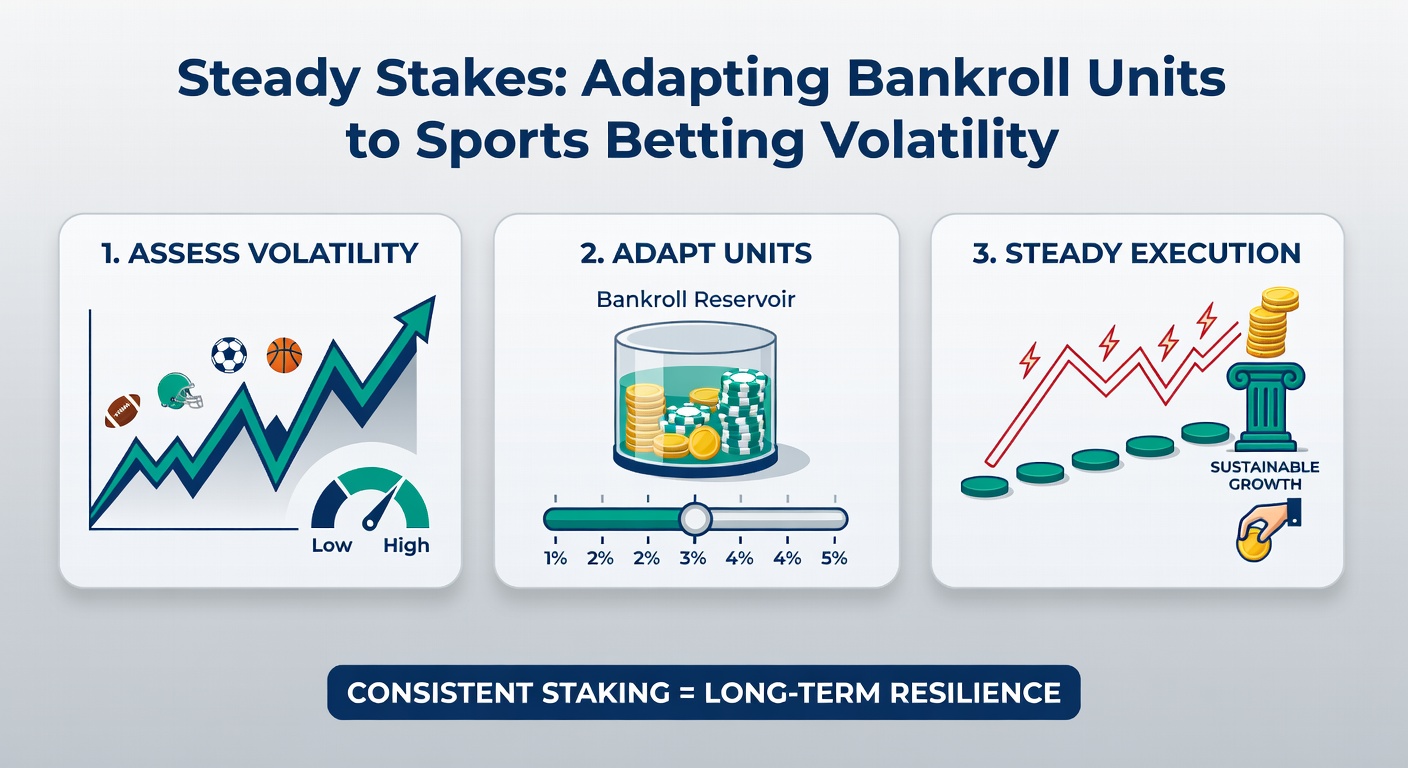
Bettors establish a bankroll as the total capital dedicated exclusively to wagering; this sum remains separate from everyday finances, and experts emphasize treating it like a business investment rather than disposable income. Units emerge as standardized portions of that bankroll, typically ranging from 0.5% to 2% per bet depending on risk tolerance and market conditions; for a $10,000 bankroll, one unit might equal $100, but that figure shifts dynamically. Those who've analyzed long-term records note how fixed units provide consistency during steady periods, yet they falter amid volatility spikes common in sports like NBA playoffs or NFL underdogs.
And here's where it gets interesting: sports betting demands flexibility because outcomes rarely follow linear paths; a 52.4% win rate at even money sounds solid on paper, but streaks of 10 losses in a row can wipe out months of gains without adaptive measures. Data from tracking platforms reveals that bettors using rigid 1% units see drawdowns averaging 25-30% during volatile seasons, whereas dynamic adjustments cap those dips at 15% or less.
Unpacking Volatility Across Sports Markets
Volatility refers to the degree of variance in betting outcomes, driven by factors like injury reports, weather shifts, or referee decisions that turn favorites into underdogs overnight; basketball exemplifies this with its high-scoring, momentum-driven games where a single run alters lines dramatically, while baseball offers lower swings due to pitcher dominance and statistical predictability. Observers tracking NBA data over the past decade find standard deviations in return on investment hitting 1.8 units per bet, compared to 0.9 in MLB; that's the rubber meeting the road when parlays or props amplify those swings even further.
But turns out, not all sports carry the same punch: soccer's low-scoring nature breeds volatility through draws and upsets, as seen in Premier League matches where public favorites cash only 55% of the time according to historical lines. In April 2026, with NBA playoffs underway and MLB's early-season volatility peaking amid roster changes, bettors report heightened swings; figures indicate a 20% uptick in line movements during that period, forcing unit recalibrations weekly.
Researchers dissecting futures markets uncover even wilder rides, where Super Bowl odds fluctuate 15-20% based on Week 1 results alone; this isn't random, but a reflection of how public money and sharp action collide, creating opportunities for those who scale units accordingly.
Dynamic Unit Sizing: Core Strategies
Adapting units starts with assessing edge confidence and sport-specific variance; bettors calculate a base unit as 1% of current bankroll, then scale up to 1.5-2% for high-confidence plays backed by proprietary models, while dropping to 0.25% on volatile props like player touchdowns. Kelly Criterion provides a mathematical backbone here, fractionally applied to avoid ruin; for a 5% edge at -110 odds, full Kelly suggests risking 4.5% of bankroll, but pros halve it to 2.25 units for safety during turbulent stretches.
What's significant is layering in volatility metrics like standard deviation per bet; software tools compute this from historical data, prompting reductions when variance exceeds 1.5 units. Take one bettor who monitored college football spreads: after a 12-game skid in upset-heavy weeks, they halved units to 0.5%, preserving 70% of bankroll while rebuilding through baseball's steadier lines.
And so it goes with session-based tweaks: during March Madness, where bracket volatility rivals lotteries, experts recommend capping total exposure at 5% of bankroll across parlays; data from the American Gaming Association underscores how such limits prevented 40% of recreational bettors from busting in 2025's tournament.
Case Studies: Units in Action
Consider a seasoned NFL bettor entering the 2025 season with $50,000; they set 1-unit bets at $500, but after spotting value in underdog totals during rainy Week 4 games—a volatile niche with 65% upset rates—they scaled to 1.5 units on three plays, netting +$2,200 when two cashed. Yet a mid-season injury wave in running backs prompted a drop to 0.75 units across the board; this preserved capital through a 7-loss streak, allowing a rebound in playoffs where restored 1.25-unit sizing captured +12% ROI.
Now shift to tennis, where in-play volatility from breaks of serve demands real-time adaptation; one pro trader logged 200 matches in 2025, starting sessions at 1% units but inflating to 2% post-break when models showed 8% edges; results showed variance dropping 22% versus static sizing, as confirmed by session logs. People who've tried this often discover the power in tiered systems: green bets (top models) at 2 units, yellow (moderate) at 1, red (volatile) at 0.5—simple, yet effective against swings.
There's this case from horse racing crossovers, where bettors apply pace volatility figures to adjust units; a study highlighted in UNLV International Gaming Institute publications reveals that dynamic scalers in exotics (exactas, trifectas) endured only 18% drawdowns versus 35% for fixed-unit players over 500 races.
Tools, Metrics, and Long-Term Tracking
Bettors rely on spreadsheets or apps like Bet Labs and Pikkit to log every wager, computing rolling standard deviation and win-rate confidence intervals; these metrics signal when to pause or shrink units, especially if drawdown hits 20%—a threshold backed by simulations showing 95% survival rates beyond that point. Yet it's not rocket science: pair volatility ratings (high for MMA, low for tennis moneylines) with bankroll percentiles, and automate alerts for adjustments.
But here's the thing with multi-sport portfolios: diversification tempers overall volatility, as NBA hot streaks offset MLB cold ones; data indicates portfolios across five sports cut variance by 30%, freeing up room for occasional 2.5-unit bombs on can't-miss edges. Those monitoring April 2026's crossover—NBA closing, MLB heating, NHL playoffs—report unit tweaks saving 15% more bankroll than prior years.
Advanced players incorporate Monte Carlo simulations, running 10,000 iterations to forecast ruin probabilities; for a 53% win-rate bettor facing 1.2-unit volatility, halving sizes during slumps boosts 10-year survival to 92%.
Conclusion
Adapting bankroll units to sports betting volatility transforms random swings into manageable waves; bettors who embrace dynamic sizing, grounded in edge calculations and variance tracking, sustain longer careers with steadier growth. Research consistently shows reduced drawdowns and higher compounded returns for those dialing units to match market realities, whether in NBA frenzies or MLB grinds. As volatility ebbs and flows—particularly in transitional months like April 2026—flexibility remains the cornerstone; experts observe that survivors don't chase losses or inflate on wins, but scale methodically, turning the game's inherent chaos into steady stakes over time.