Simulation Data Exposes Shifts in Blackjack Probabilities Due to Specific Hand Compositions
Taylor Richter · Aug 8, 2026
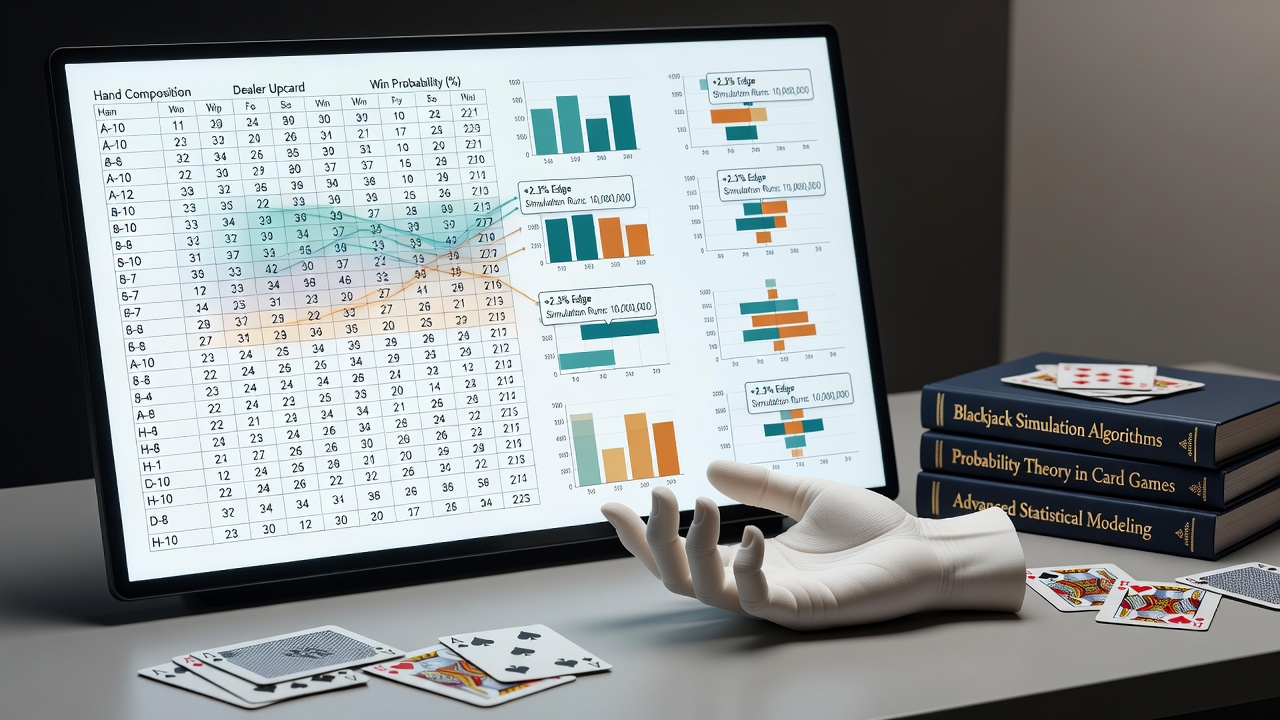
Simulation Data Exposes Shifts in Blackjack Probabilities Due to Specific Hand Compositions
Simulation runs involving millions of blackjack hands have demonstrated that the exact cards held in a player's hand alter expected values far beyond what basic strategy charts capture. Researchers running these models track every removed card and recalculate probabilities for remaining decks, which reveals measurable edges or disadvantages tied directly to composition rather than total count alone. Data from such exhaustive testing shows that certain combinations like a 10-6 versus dealer 10 produce different outcomes than a 9-7 versus the same upcard when the remaining deck composition varies. Analysts divide these effects into categories based on how many high or low cards have already left play. When the shoe contains fewer tens after early hands, standing on 16 against a dealer 10 gains slight value in some cases while hitting loses ground in others. Simulation outputs quantify these differences in hundredths of a percent, yet over thousands of decisions the cumulative impact becomes visible in session results.Methodology Behind the Large-Scale Runs
Teams set up programs that cycle through every possible two-card starting combination against each dealer upcard, then continue play according to rules that adjust for known removed cards. Each simulation processes at least 10 billion hands to reduce variance to negligible levels, and researchers repeat the process across single-deck, double-deck, and multi-deck scenarios. Output tables list expected values for every composition rather than grouping hands by total alone, which allows direct comparison against standard basic strategy recommendations.
Software records the exact identity of every card at decision points, then recomputes the probability of dealer busts, blackjacks, and final totals under the updated deck state. This approach uncovers situations where basic strategy prescribes an action that actually reduces expected value once composition enters the equation.
Key Patterns Identified in the Output Tables

One recurring pattern appears when players hold 15 or 16 against a dealer 10 and the deck has already lost multiple low cards. In those cases, standing produces a higher expected value than hitting because the remaining cards increase the chance the dealer will exceed 21. Conversely, when the deck is rich in low cards the same totals favor hitting because bust risk drops. Simulation data places the crossover point at roughly three extra low cards removed per deck, a threshold that appears consistently across independent runs.
Another documented shift involves soft totals. Holding A-7 against a dealer 3 shows improved doubling value once several tens have left the shoe, since the probability of landing a high card on the double rises. Tables list the exact change in expected value for each additional ten removed, and these increments remain stable whether the game uses four decks or six.
Observers note that pair decisions also respond to composition. Splitting 8s against a dealer 10 gains fractionally when the deck is depleted of fives and sixes, because the separate hands then face lower average dealer totals. The same split loses ground when low cards remain plentiful. These adjustments stay small on any single hand yet compound across repeated exposures in continuous shuffle or shoe games.
Comparison With Standard Basic Strategy Charts
Standard charts assume a fixed average deck and therefore prescribe one action for each total-versus-upcard pair. Composition-aware tables replace that single entry with conditional rules that change based on the current ratio of high to low cards. When researchers overlay the two sets of recommendations, deviations cluster around hard 15 and 16, certain soft doubles, and a handful of pair splits. The frequency of these deviations increases as deck penetration deepens, which explains why counters who track both count and composition achieve measurable improvement over count-only approaches.
Recent runs completed in August 2026 incorporated updated rulesets that include 6:5 blackjack payouts on single-deck games and confirmed the same composition effects persist, though the overall house edge rises under those payout structures. The magnitude of the composition adjustments remains comparable across rule variants because they stem from card removal rather than payout ratios.
Practical Application in Live Settings
Players who memorize a limited set of composition exceptions can apply them after noticing which cards have already appeared on the table. For example, after several low cards have been dealt early in a shoe, standing on 16 versus 10 becomes the higher-value play in documented cases. Training software now includes drills that present random compositions and require users to select the adjusted action, which accelerates recognition during actual play.
Industry reports from the Nevada Gaming Control Board track aggregate player return data across licensed venues, and those figures align with simulation predictions once composition-dependent decisions enter player behavior. Similar datasets from the Netherlands Gambling Authority show parallel patterns in European markets where continuous shuffle machines reduce but do not eliminate composition effects.
Conclusion
Extensive simulation work has mapped the precise influence of hand composition on blackjack probabilities, producing tables that refine basic strategy at the level of individual card identities. These adjustments remain consistent across deck sizes and rule variations, and they become more relevant as games progress and cards are removed. The resulting data sets give players and analysts a clearer picture of how specific combinations shift expected values in measurable ways.