Charting Paytable Fluctuations in Video Poker Against Long-Term Viability Indicators
Rafael Krüger · Aug 22, 2026
Charting Paytable Fluctuations in Video Poker Against Long-Term Viability Indicators
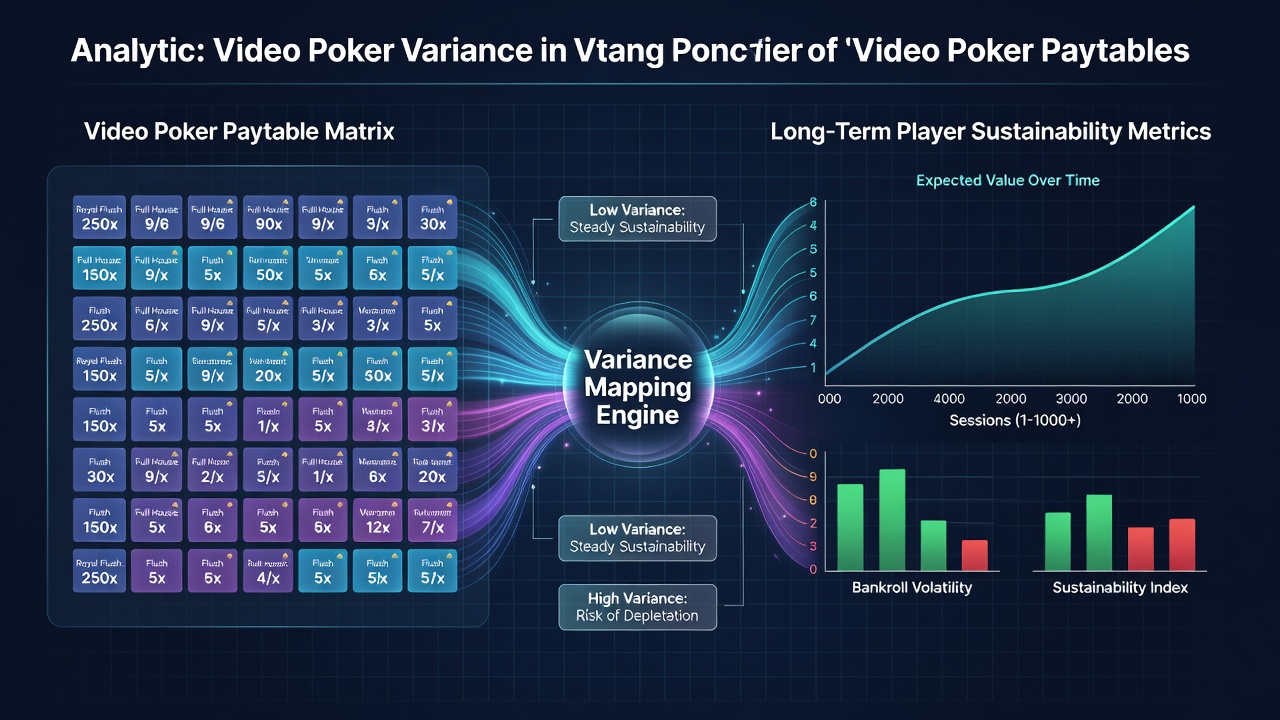
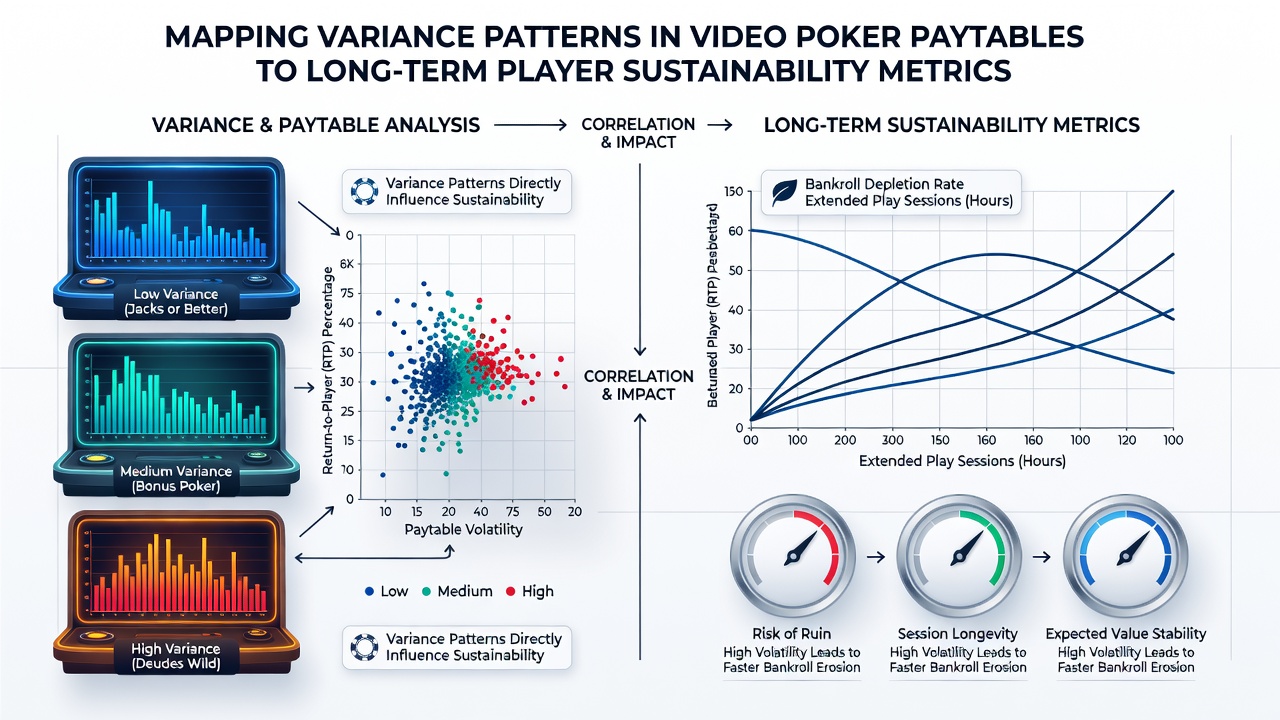
Video poker machines operate on fixed mathematical structures where paytable configurations directly shape outcome distributions across thousands of hands, and observers note that these distributions create measurable patterns when tracked against player bankroll duration. Data from gaming laboratories shows that full-pay versions of games like Jacks or Better produce lower variance than their short-pay counterparts, while games such as Deuces Wild introduce higher swing potential through wild card mechanics that alter hit frequencies on premium hands.
Paytable Structures and Variance Calculation Basics
Each paytable assigns specific returns to hand rankings, and researchers calculate variance by examining the squared deviation of each possible outcome from the game's expected value, then weighting those deviations by their probabilities. A standard 9/6 Jacks or Better paytable yields an expected value near 99.54 percent when played with optimal strategy, whereas a 8/5 version drops that figure while compressing or expanding the spread of returns depending on how royal flush and straight flush payouts adjust. Studies from the University of Nevada's gaming research division indicate that variance rises sharply when royal flush payouts increase without corresponding adjustments to lower hands, because the infrequent massive payouts pull the standard deviation upward even as overall return percentage stays similar.
Players encounter these patterns through extended sessions where short-term results cluster around the mean or deviate sharply based on paytable design, and analysts map these clusters by running Monte Carlo simulations that replicate millions of hands to reveal sustainability thresholds. In August 2026, updated simulation datasets released by independent testing facilities highlighted how certain 10/7 Double Bonus Poker variants maintain moderate variance levels compared with older 9/6 models, allowing longer average play intervals before bankroll depletion occurs under fixed wager sizes.
Connecting Variance Patterns to Sustainability Metrics
Long-term player sustainability metrics include expected session length before ruin, required bankroll multiples for a given risk of depletion, and the frequency of reaching positive return thresholds within defined time windows. Observers map variance patterns onto these metrics by dividing standard deviation by the square root of the number of hands played, which produces a shrinking error margin that reveals how quickly a game's natural volatility settles toward its theoretical return. High-variance paytables demand larger bankroll cushions because the wider distribution of outcomes increases the probability of extended losing streaks, whereas lower-variance tables permit smaller reserves while maintaining comparable survival rates over equivalent hand volumes.
One study released in 2025 by a Canadian research consortium tracked actual play data from regulated venues and found that participants using 6/5 Jacks or Better paytables experienced average session durations roughly 18 percent shorter than those using 9/6 versions when starting bankrolls remained constant. The same dataset revealed that Deuces Wild paytables with elevated royal payouts extended the tail of the return distribution, pushing the ruin probability higher unless players adjusted wager size downward relative to total funds available.
Practical Mapping Techniques Used by Analysts
Analysts construct variance maps by first isolating the contribution of each hand category to overall volatility, then plotting cumulative distribution functions that display the percentage of sessions ending above or below break-even points. These maps incorporate real-time adjustments for comp accrual rates and promotional multipliers that effectively shift the mean return upward, thereby reducing the number of hands needed to reach sustainability benchmarks. Regulatory bodies in Nevada and New Jersey publish aggregated machine performance reports that supply the raw frequency data needed for such mapping exercises, and those figures reveal consistent relationships between paytable generosity and observed play duration across thousands of units.
Turns out the relationship holds across multiple game families, because the underlying probability engine remains constant even when surface-level payouts change. Researchers discovered that adding a single coin to the royal flush payout on a 9/6 Jacks or Better machine increases variance by approximately 0.8 units while lifting expected value by less than 0.3 percent, demonstrating how small paytable tweaks create outsized effects on long-term endurance. Those who've studied this know the effect compounds over repeated sessions, so operators and players both track these shifts through standardized volatility indices published by testing laboratories.
Regional Data Sources and Recent Findings
Reports from the Nevada Gaming Control Board supply monthly hold percentages and theoretical win figures that align closely with variance models derived from paytable analysis, and similar datasets from Australian regulatory archives confirm the same directional patterns in multi-game video poker terminals. Academic papers hosted by the University of Queensland's gambling research center further demonstrate that bankroll-to-wager ratios must scale with measured variance to keep depletion risk below five percent over 10,000-hand horizons. These sources provide independent verification that paytable selection functions as the primary controllable variable in determining how long a given bankroll supports continued play.
Conclusion
Mapping variance patterns in video poker paytables to sustainability metrics produces concrete numerical relationships that operators and researchers apply when evaluating game configurations. The process relies on established statistical methods, simulation outputs, and aggregated performance data rather than anecdotal observation, and teh resulting indicators allow precise forecasting of session viability across different paytable families. Continued refinement of these maps occurs as new simulation runs incorporate updated machine data and refined strategy optimizations.